
That’s the number one thing people ask me when it comes to simulating audiences and getting responses from LLMs.
Of course there’s a lot going on under the hood, but I’ll try to walk through what’s happening underneath, from the “sauces” to the “harnesses” we use to pull our audiences closer to ground truth and real-world simulation.
Honestly, there are several things that bridge us to our 0.6 to 0.7 ρ-coefficient on real-world datasets for audience simulation. We’re currently training our first model on this, and in the meantime we’ve gotten very confident in what we’re doing with an off-the-shelf model. So let me explain.
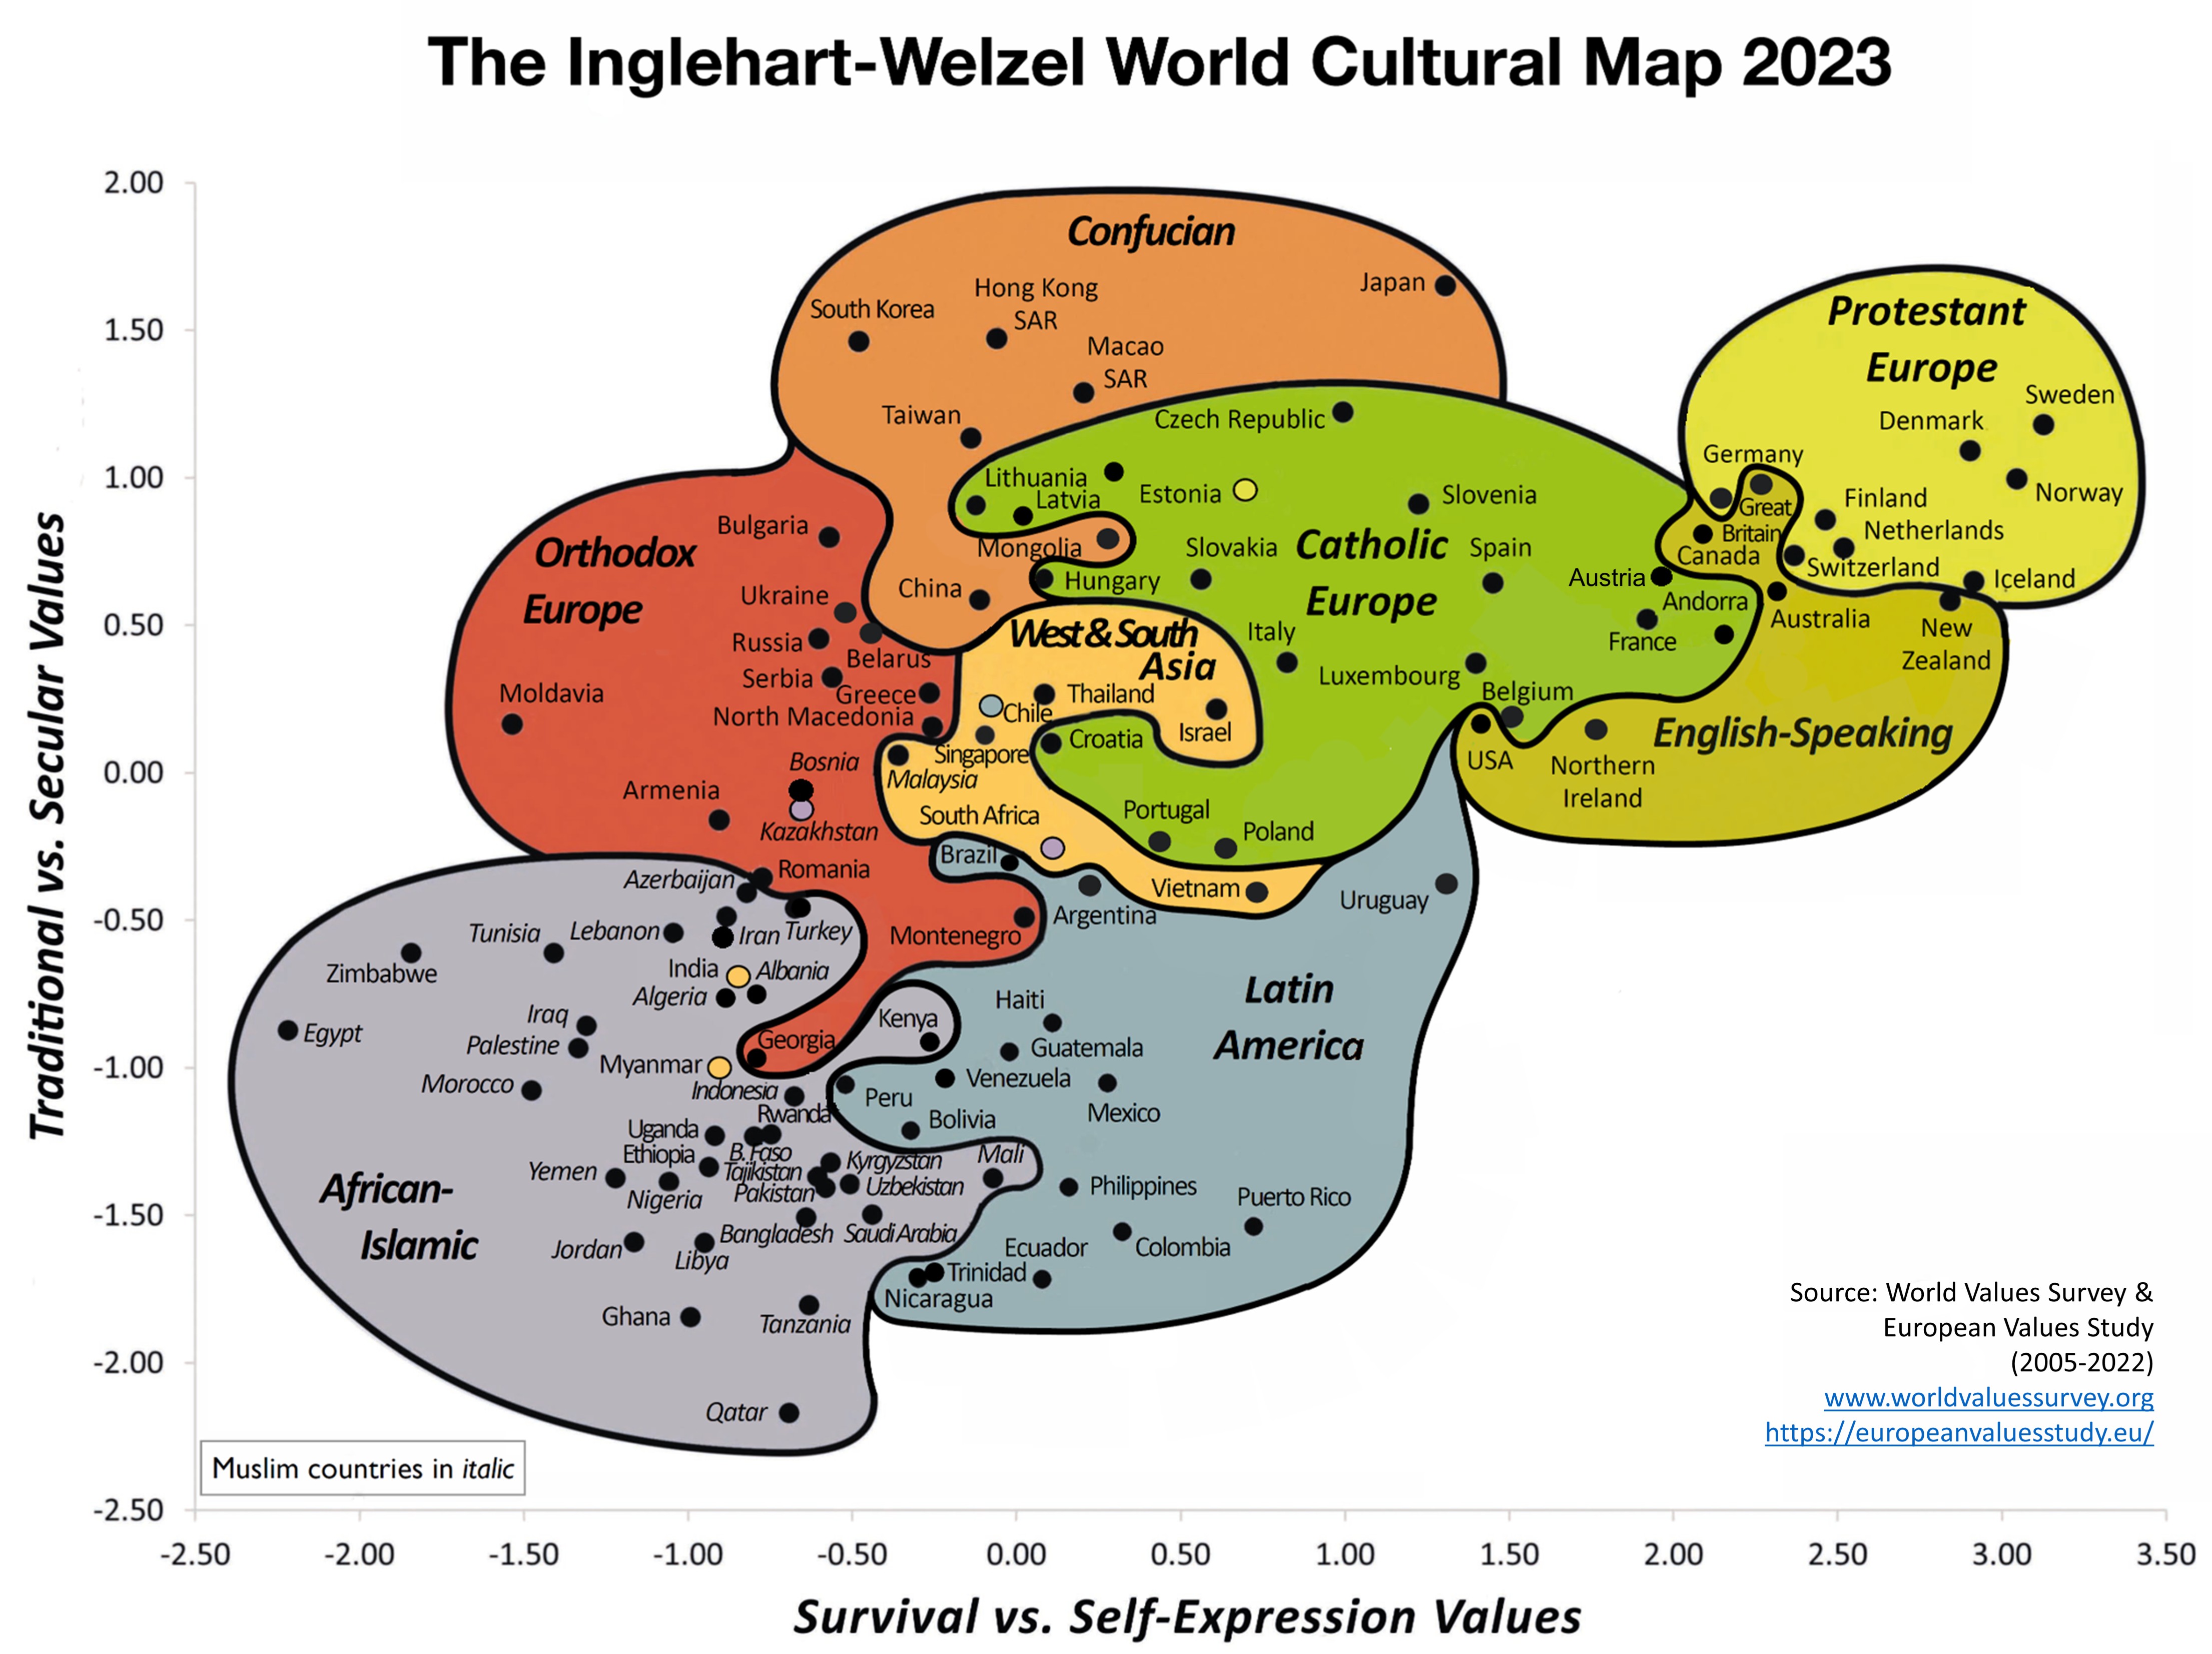
Sauce #1: World Values Survey
The first thing that happens when you create an audience to test ads — and soon websites, emails, and other UX flows — is the World Values Survey (WVS). It all starts here, at the top of the funnel.
Source: worldvaluessurvey.org
We ask for five things when you create an audience:
- Age
- Location
- Gender
- Race
- Income Level
These are the five most important inputs when generating a persona on an LLM. Once you’ve submitted that persona, we run verifier tests inside the model. One of the bigger and most relevant tests is having it fill out the WVS and checking whether it matches the same real-world audience. There are a lot of reasons big models sometimes fail to match real-world audiences.
Why do they fail?
There are a lot of audiences they can’t simulate, either because they’re a) out of distribution (OOD) or b) such a minority that there wasn’t enough training data on them.
Many of these tests exist to see whether we can simulate cultural things accurately, which are VERY relevant to purchase behavior, click behavior, and ad understanding. That’s the reason we have them fill it out. It costs us nearly nothing, and you can quickly and accurately test whether it’s even possible. If our original model can’t predict the cultural values of that audience, we automatically test it with other models to make sure we can provide a correct simulation. There are cases where some ethnic groups can’t be simulated, and when that happens, we tell you.
Those are super rare, and typically outside the US or Europe.

Sauce #2: The Prompting
Right, this is going to sound insane, but obviously you can’t just say “Hey model, react to this advertisement as this audience and tell us what you think.” That’s pointless. You’d think it would be that easy, but it isn’t, and several studies cover why, so I won’t go deep here.
So what can you do?
It’s all diagnostic on emotional cues when you open an app. The psychology behind which app you open throughout the day is largely an emotional breakpoint. What you feel when you open LinkedIn, Instagram, and TikTok are entirely different. That’s why, during audience creation, we ask the model when and why it picks apps throughout the day.
Sure, we have some defaults, but every person is different and so is your audience.
Next, we use anti-survey prompts. Not surprisingly, “You’re not in a survey” is way more effective at pulling truth out of the model than saying nothing about a survey at all. This matters when crafting the model’s response to creative.
Then there are our anchors. We use anchors in the prompt that correlate to your goal on whatever platform you’re on — e.g. Performance Max for Google, Reach for Facebook, Impressions on Reddit. These anchors are what we compare the embedding model’s words against to get the response. Each objective is its own behavioral node.
We’re essentially building the perfect prompt based on audience values and the specific service the user is on.
Note: some examples are “thumb-stopping,” “eye-catching,” “better than the last ad,” etc.

Harness #1: The Images
So you’ve created your audience. Now you need to score your ads. Semantic similarity is how close the model’s response is to the anchors we’ve provided. For brevity, we use anywhere from 6 to 10 different anchor embeddings depending on the objective.
Images are unique, because you need a vision model to understand them and respond. You also need a model with the granularity to see more than one image at a time. That limits which models we can use in a single pass, and we’ve done extensive research across models and evaluations to find the best universal ones.
So what do you show them? In real life you scroll with your thumb, and our models do the same. We prompt them to act as though they’re scrolling through the images. We show them several things.
We generate images before and after the ad we want to test. Those surrounding images are completely randomized and depend on who the audience is and the platform. But essentially we show them screenshots before, during, and after the ad.
This lets us get near-accurate readings on ad performance from past data. Of course, one of our biggest worries is creative fatigue, since it’s a knowledge-cutoff kind of thing, so it’s hard to measure. We have ways of counteracting it, but our game is “does the ad work” from new angles, not running pilots on old ideas.
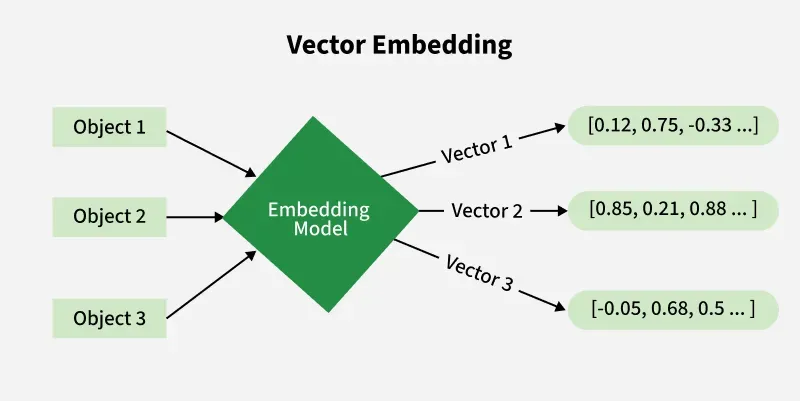
Harness #2: Embedding Models
I mentioned we use anywhere from 6 to 10 embeddings in those anchors. Each embedding has 5 layers tied to Likert scales. Examples: Would you click this? Does it stop your thumb? Would you read this post?
On top of the embeddings, we use multiple embedding models to bring the reading closer to accurate. We run each simulation through two models, then feed that into the embedding models. Then we trim the outliers.
Why trim? We’re hunting outliers. Sometimes models give weird responses — you never fully know what’s going to come out — but with some temperature techniques and value-floors we can get very close to an accurate semantic similarity ranking and drop the outlier rankings.

How we actually know it works
Everything above is how we build the simulation. None of it matters if it can’t pick a real winner. So we test it against ads that already won.
Here’s the logic. Advertisers kill losing creative fast. Nobody keeps paying to run an ad that doesn’t work. So an ad that’s still running months later, with budget behind it, is a winner the market already paid to keep alive. That’s not our opinion, that’s revealed behavior. People are bad at telling you what they’ll click. They’re not bad at actually clicking.
So we pull the ads that have run the longest in a given space and rank them cold. Blind. We score them before we know which ones survived. Then we check our ranking against reality, and the long-runners are the ones our system already put on top. That’s the whole game. Not “does this ad feel good,” but does our ranking match what actually performed when real money was on the line.
I’ll be honest that it’s a proxy. Longevity is a strong signal, not a perfect one. Big brands sometimes let an evergreen ad ride no matter what. But across enough creative the pattern holds, and that’s how we get to the 0.6 to 0.7 correlation I mentioned up top.
And here’s where it gets useful for you. We can point the same engine at your competitors. We pull the ads they’ve kept running the longest, rank them, and show you what’s likely working in your category before you spend a dollar finding out yourself.
Wrap up
We at Kettio do our best to accurately simulate real social feeds and behaviors, using objectives tied to behavioral psychology. These tactics, plus the validation behind them, let us predictably show how your ad will perform across a wide variety of areas. Before you spend a dollar.
Want to see it on your own creative? Run a free test at kettio.com.
Frequently asked questions
How does Kettio validate its audience simulations?
Kettio scores ads blind, then checks its ranking against which ones survived longest in market. A long-running ad is a winner the market already paid to keep alive, so matching that ranking is real-world validation. This is how Kettio reaches a 0.6 to 0.7 correlation on real datasets.
What is the World Values Survey used for in Kettio?
Kettio has each audience persona fill out the World Values Survey and checks whether the model’s answers match the real-world audience. If a model cannot reproduce an audience’s cultural values, Kettio tries other models or tells you that audience cannot be reliably simulated.
Why doesn’t Kettio just ask the model to rate an ad on a scale?
LLMs are poor at numeric self-rating and tend to hedge toward the middle. Kettio instead captures a free-text reaction and compares it to calibrated anchors using semantic similarity, which preserves more signal than a Likert-style score.
Try it on your ads
Compare your own ads, free.
Upload two static ads, choose your buyer, and get a quick prediction with clear next steps. No signup or credit card.
Find my winning ad →